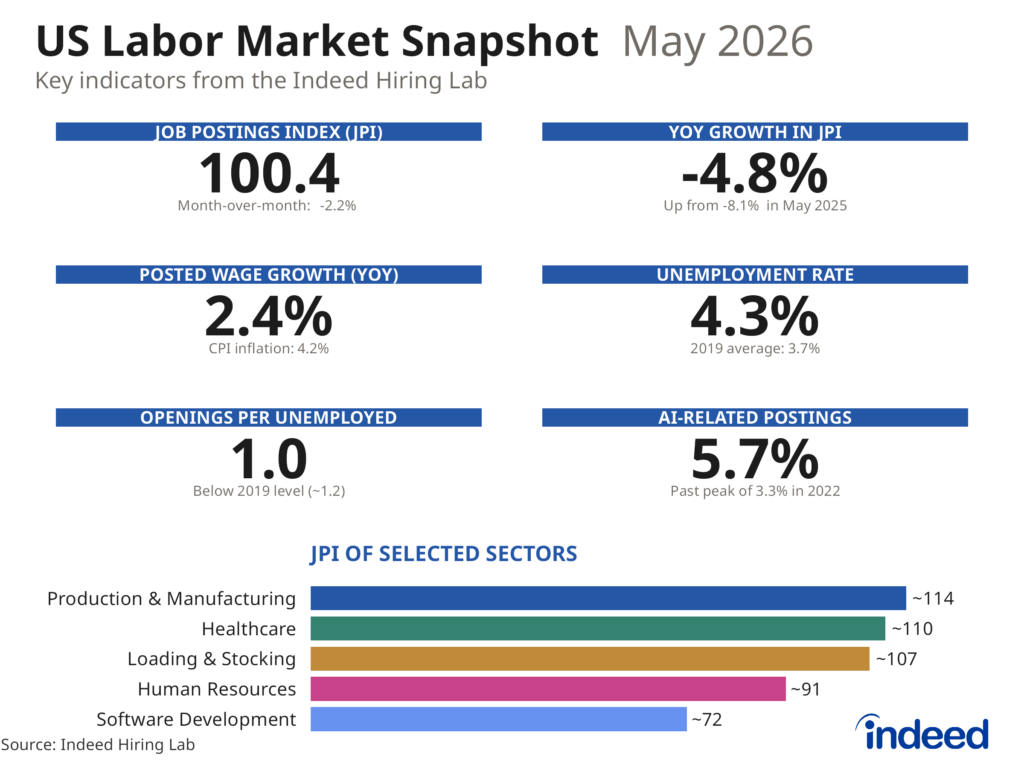
The Indeed Hiring Lab monthly snapshot of the US labor market summarizes where key indicators — job postings, wages, unemployment, and openings — stand as of May 2026 and flags the trends worth watching in the months ahead.
The Big Picture
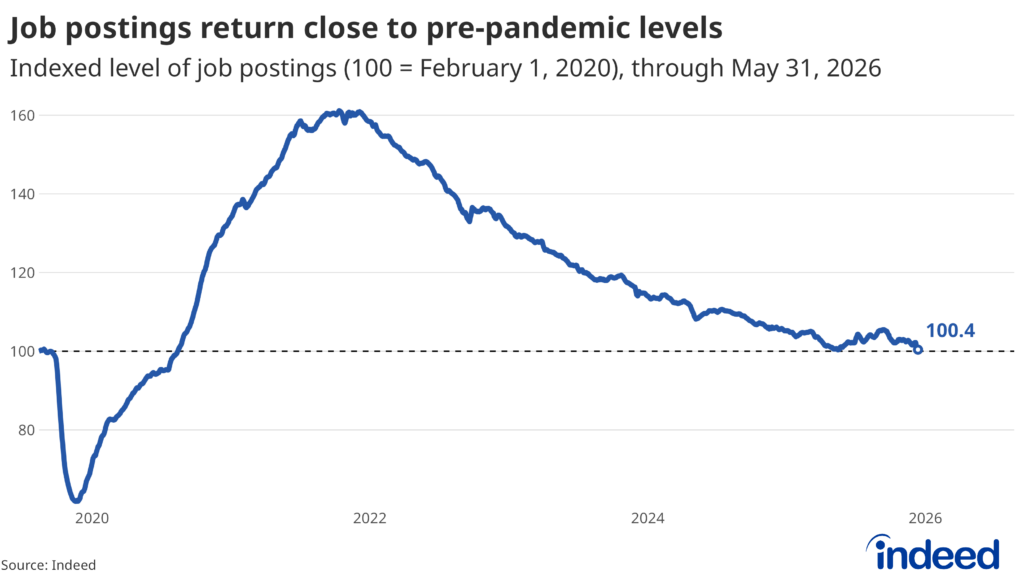
Overall hiring demand has essentially returned to where it stood in early 2020, with Indeed job postings roughly even with the immediate pre-pandemic baseline. That may sound ominous, but the pre-pandemic job market was generally strong and balanced. Even so, despite a strong payroll report in May, this is still a low-hire, low-fire market, and the labor data have yet to point to gathering momentum.
Job Postings
Where we are: Indeed’s JPI stood just 0.4% above pre-pandemic levels (at 100.4) as of May 31, 2026. This is back in line with the trough seen last fall, throwing a bit of a wet blanket on early-year momentum in labor demand.
Direction of travel: Monthly growth in the JPI trended positive at the turn of the year, but readings slipped over each of the past three months, sliding 2.2% in May. Year-over-year change (-4.8%) also remains negative.
Wages
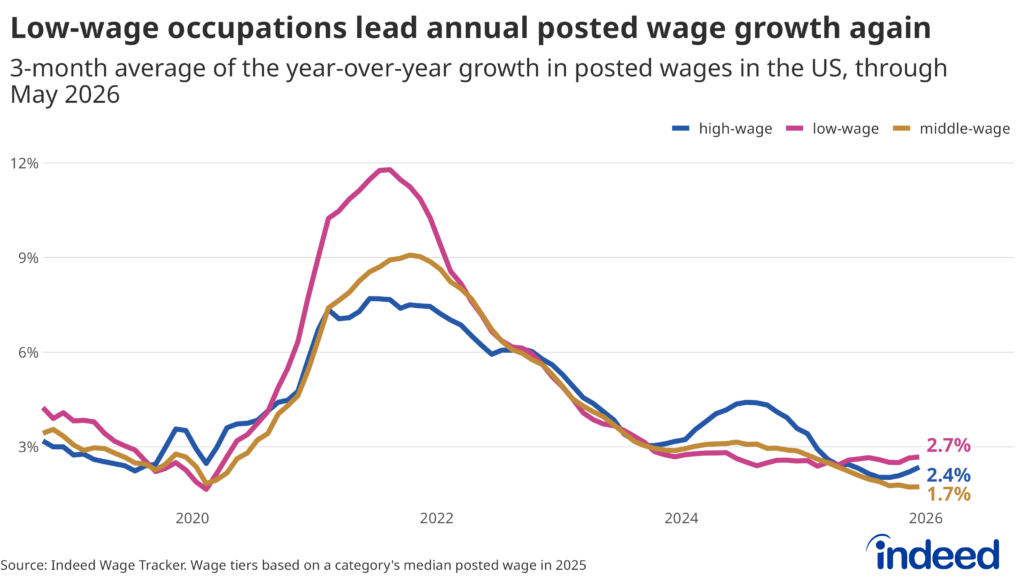
Headline: Posted wage growth held at 2.4% year-over-year in May. Beneath the trend deceleration in overall posted wage growth, an interesting dynamic is emerging in “wage tiers.” Similar to the surge in posted pay for “low-wage” occupations as the economy reopened from the pandemic, low-wage jobs are once again seeing faster growth in posted wages (2.7%) than their higher-paying peers.
The Labor Market Balance
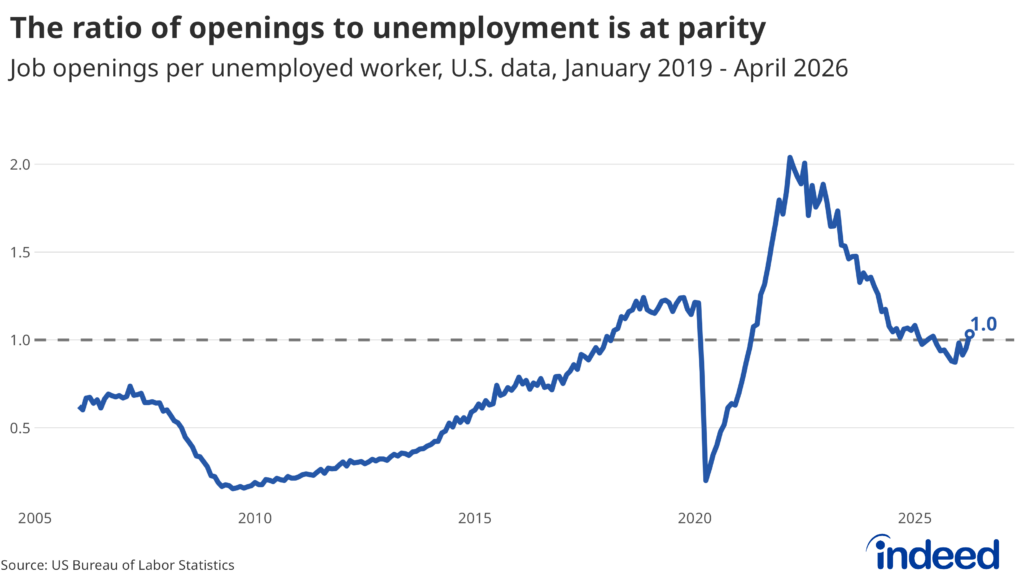
Unemployment: The unemployment rate stayed steady at 4.3% in May, where it has spent all but one month of this year. Meanwhile, the vacancy-to-unemployment ratio improved to 1.0 in April, indicating one available job vacancy for every unemployed worker. This indicator remains depressed relative to 2018-2019 and is in line with a labor market offering fewer opportunities than a few years ago.
Hires, quits, and layoffs: At 1.9%, the quits rate remains subdued, suggesting workers lack confidence that greener pastures await in new positions. In fact, hires are at a rate last seen during the long and slow recovery from the Great Recession in the early 2010s. Low layoffs remain a bright spot in the labor market, keeping net hiring positive.
What We’re Watching
- Indeed JPI nears early 2020 level: Indeed’s Job Posting Index has been hovering around 100 for the past few weeks, and if recent trends continue, it is likely to drop below 100 soon. Returning to pre-COVID levels of job postings is not inherently concerning, given the strength of the labor market in early 2020, but it is certainly worth watching.
- Monetary policy and inflation: Headline CPI inflation climbed to 4.2% year-over-year in May (the highest in over three years), driven by gas prices that are 40% higher today relative to a year ago. The recent upswing in inflation has pushed real wage growth into negative territory and threatens consumption ahead. It has also deflated expectations that the Fed will lower interest rates further in 2026.
The full chartbook with additional sector, wage, and JOLTS detail is available here.